RadarNov 3, 2026
Heatmap: how often each spot gets a nade
See how often pros smoke, flash, molly or HE each spot, on all 7 maps. Every throw counts, not only lineups.
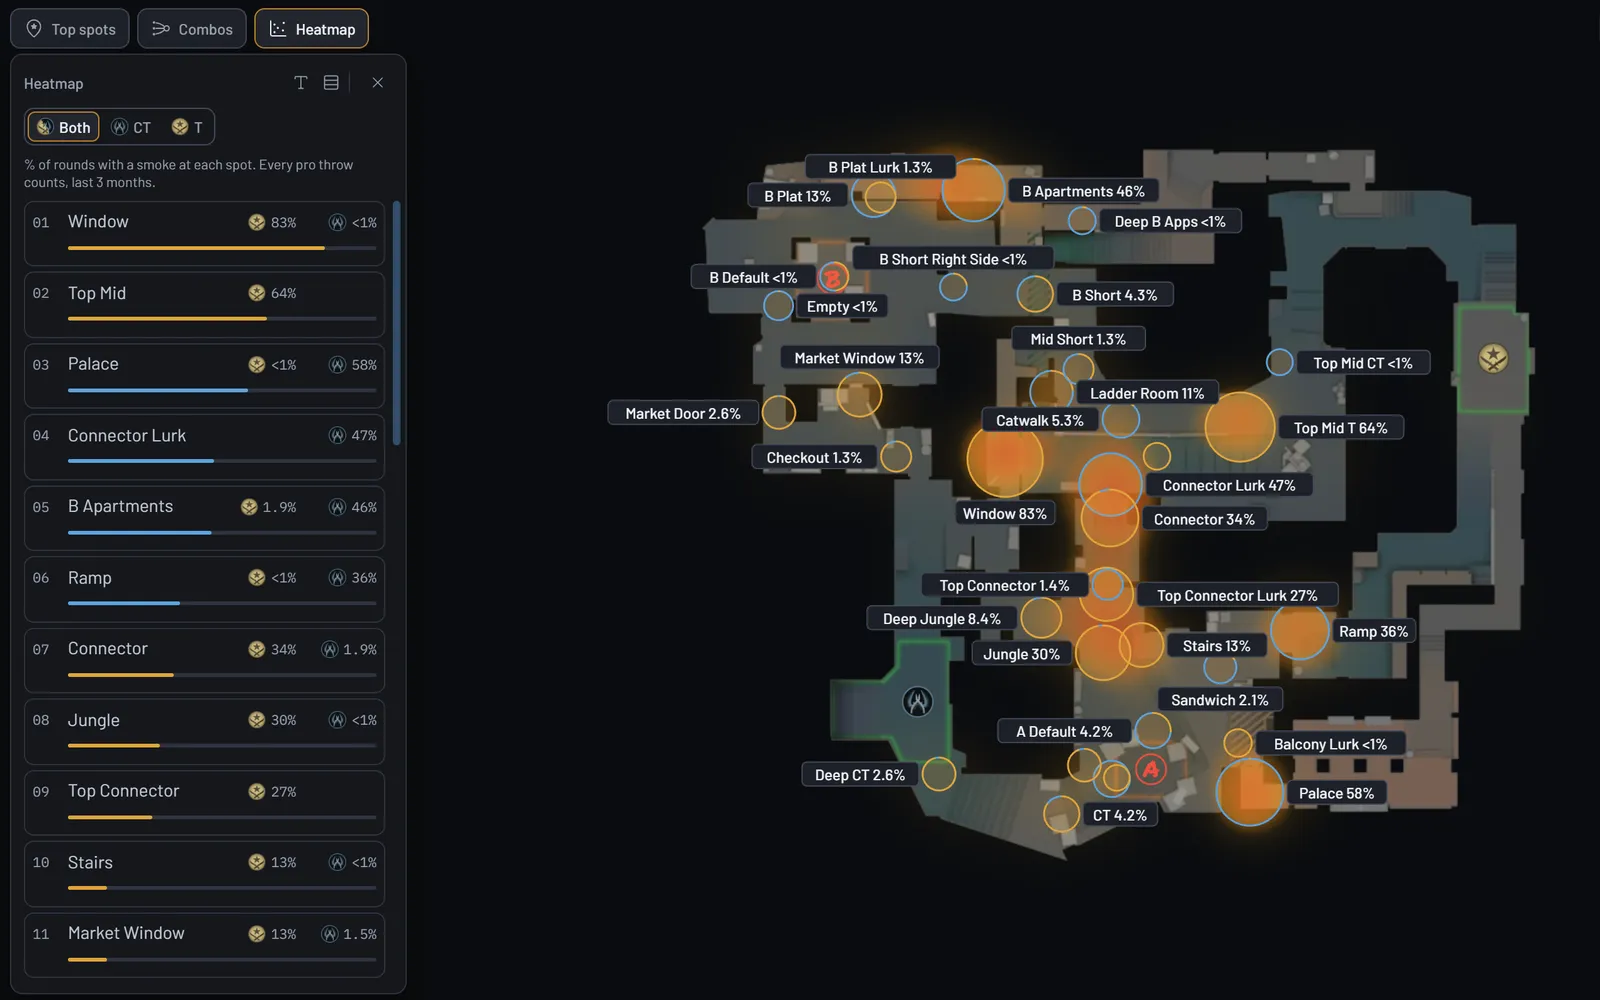


Press Heatmap on any map's smoke, flash, molotov or HE page and the radar shows the % of rounds each spot gets that nade. T smokes Window on Mirage in 83% of rounds. CT smokes Garage on Cache in 81%.
Every pro throw counts, not only the ones on a published lineup. 99% of CT smokes on Dust2 Upper Tunnels don't match any lineup, so a list of lineups alone would miss them.
Pick a spot to see its rounds, when it usually gets thrown, the lineups that land there and the teams that use it most. Both shows the two sides together, or switch to CT or T. It's live on all 7 maps, and on Nuke each floor shows its own spots.